Keeping track of expenses
People close to me know I’m such a neat freak (Ed calls it control freak. Hmph!). If my colleagues read this, they will definitely go “That’s soooo Evonne!”
Everyone has a role to play and I, I’m the official “budget keeper”. Meaning to say, I’m supposed to keep track of how much we’ve been spending, on what items, when, where, etc etc etc, right down to the cents. It’s not an easy job.
I carry a small little notepad with me everywhere I go and jot down the amount we’ve spent right after paying. At the end of the day, I will write them in my travel notebook with details: Day of travel (ie: Day 10), date, places we’ve been for that day, expenses with full description and relevant important notes. This travel notebook serves 2 functions: Keeping track of our expenses and documenting our journey.

Then, whenever I have the time, I will input all of these into an Excel spreadsheet. This is the part where I was trained well during my job and continue to practice it. Heard of Pivot Tables? Probably the most awesome Excel feature for travellers like us.
First, input all your info into a table called “Raw Data”. You can categorize them according to how you want to look at your summary later on. This is how I arrange my columns:
Day | Country | City | Item | Description | Remarks | Currency |
I have separate columns for the different currencies, depending on the countries visited. You would then input your expenses under the respective columns. Each item will take up its own row.

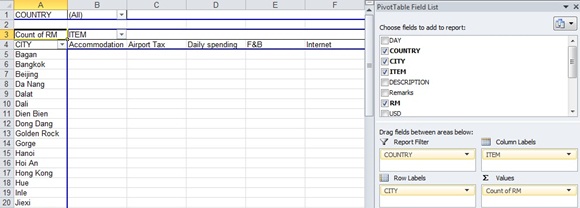
You can actually tally your expenses just using the “Raw Data” table but I turn it into a “Pivot Table” so that I can further probe the spending patterns.
First, select all the data in the “Raw Data” table. Go to Insert > Pivot Table > New Worksheet and a new worksheet will be created. On your right, you will see ‘Pivot Table Field List’ where you can drag and drop ‘Value Fields’ into the ‘Report Filter’ at the bottom, depending on how you want to look at your expenses. It might look intimidating at first, but don’t be afraid to try! Here’s a quick tutorial on how to use Pivot Tables.


This method works for us because we can just pull out the information and filter them according to what we want to know and plan where to trim down our expenses. Some of the things we’ve learned:
- Expenses for each country (Comparatively, we’ve spent the least in China)
- Cost of transportation throughout the trip (Public transportation is the cheapest, as well as trains and buses. Fly less!)
- Where did all our money go to? (Our summary of Vietnam told us that we spent the most on food! We tried eating less, but failed miserably)
There are two benefits to keeping track of your expenses and checking it regularly:
- Short-term planning: You know what you can cut-down on immediately (Been having too much fancy meals? Start eating on the streets – cheap and the best way to immerse yourself in the local culture)
- Long-term planning: You will know how much you have left and can work out a plan for your next few destinations (Running out of money too fast? Maybe it’s time to cut the trip short or start visiting less expensive places)
After 4 months, I’m still tracking our expenses religiously. Might be a hassle at times, but it’s pretty amazing to look back at our spending patterns coz a simple Excel sheet can tell so much and helps us be realistic.